Book Demo
Book Demo
Align procurement decisions with actual site demand patterns
Reduce exposure to avoidable price, volume, and peak-related risk
Use operational flexibility more strategically in energy buying


Many industrial energy procurement decisions are still based on static assumptions, fragmented planning inputs, or incomplete demand visibility. But industrial sites do not behave statically. Production schedules shift, technical loads change, and flexibility is often not reflected in procurement logic. As a result, energy buying decisions become harder to size, harder to time, and harder to optimize.
etalytics helps industrial teams connect procurement decisions with real operational energy behavior. Energy Autonomy combines historical and live site data, forecasting logic, and flexibility analysis to create a stronger basis for industrial energy procurement.
Instead of treating demand as fixed, the solution helps teams understand how energy demand behaves, how it may change, and where operational flexibility can improve procurement outcomes.
Typical optimization modules and use cases:

Structure historical and live energy data by time, asset, utility, and operating condition to reveal actual consumption behavior
Evaluate procurement-relevant demand scenarios against changing market conditions and risk windows
Identify where operational flexibility can influence when and how energy is procured
Bring operational, technical, and energy data into one shared view for planning and decision support
Compare demand, market, and operating scenarios before procurement decisions are made
Reduce total energy input and cost across the optimized scope.
Measured by normalized kWh or MWh consumption, energy cost in EUR or USD, and savings compared with an agreed baseline.
Reduce emissions by operating assets more efficiently and shifting operations where lower-carbon energy is available.
Measured by CO2e reduction over a defined period.
Reduce manual setpoint changes, overrides, and reactive troubleshooting.
Measured by manual intervention rate, override events, and operator time spent on recurring control adjustments.
Avoid unnecessary operation and prioritize efficient modes such as free cooling, optimized part-load operation, and coordinated asset use.
Measured by runtime hours, start-stop cycles, and utilization of active versus passive or more efficient modes.
Maintain temperatures, pressures, humidity, airflow, or other operating parameters within defined boundaries.
Measured by deviation from target ranges and percentage of time within operating limits.
Use thermal inertia, storage, on-site generation, and price signals where relevant.
Measured by shifted load, avoided peak demand, use of favorable tariffs, or demand response participation.
Quantify savings potential, technical fit, risk, and implementation effort before scaling.
Measured by expected savings versus solution cost and a clear rollout decision.

Optimize cooling plants, free cooling, hydraulic distribution, airflow-related dependencies, and supply temperatures while protecting mission-critical uptime and stability.
Improve HVAC and utility efficiency while maintaining stable environmental conditions, compliance requirements, and operational boundaries.
Coordinate cooling, heating, ventilation, thermal utilities, and electrical infrastructure under fluctuating production loads and changing energy prices.
Reduce energy waste in process cooling, ventilation, heating, and site-level energy systems with variable production schedules and operating modes.
Improve performance in complex HVAC environments where demand, occupancy, weather, and operating schedules change continuously.
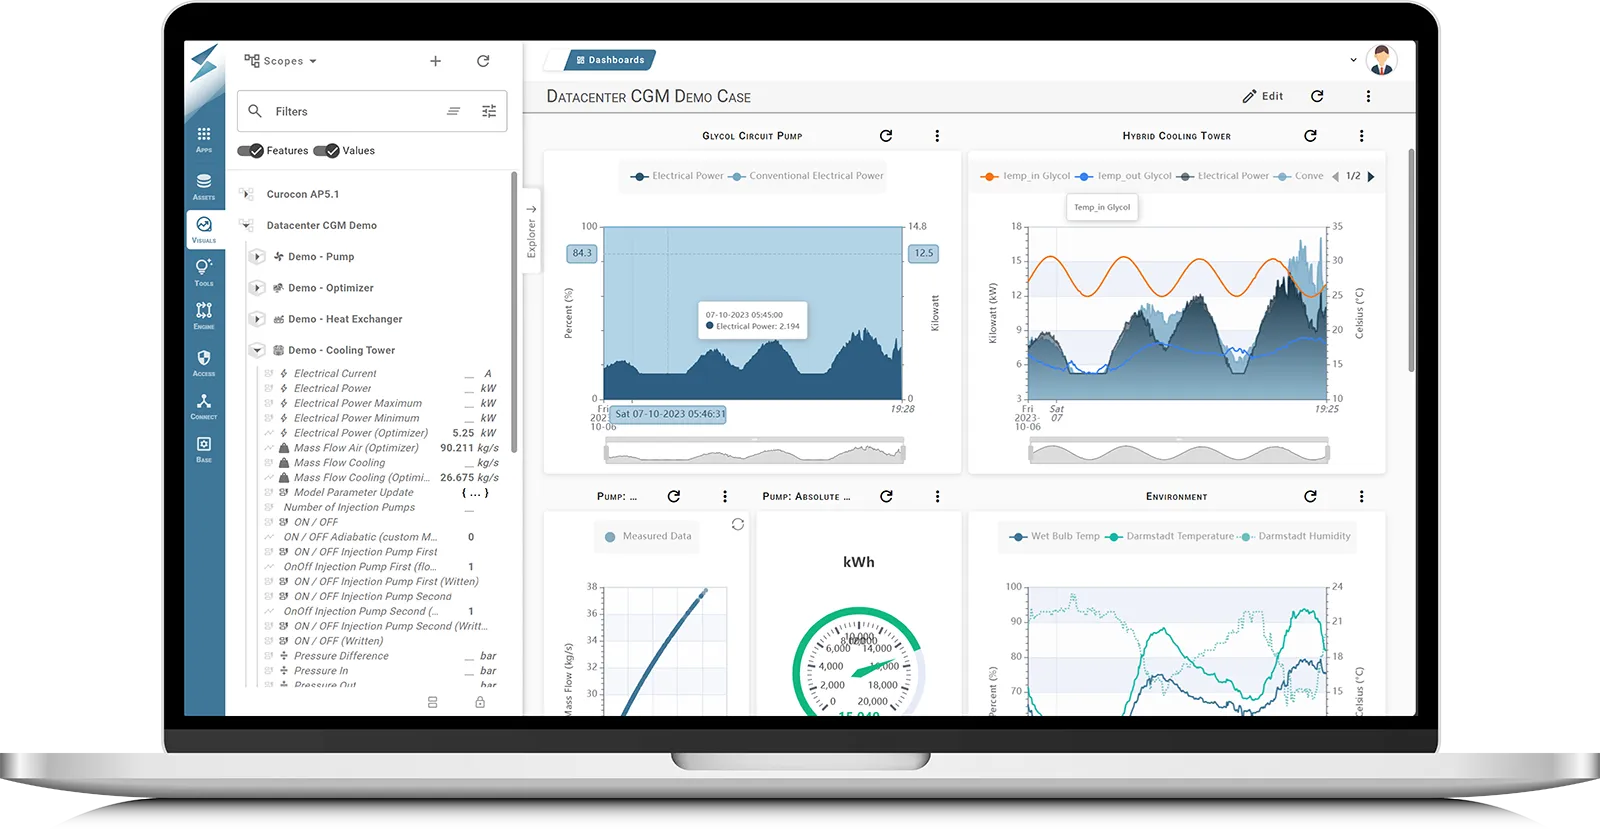
etaONE® turns your operational data into a live digital twin of your energy system and uses AI to continuously identify the best operating strategy for your site. The result is lower energy cost, earlier detection of performance drift, and better operational decisions with less manual work – without replacing your existing infrastructure.
Built for real-world systems
We model your actual chillers, pumps, heat exchangers, and cooling assets – not a generic template.
Physics-based, data-trained
Our digital twin combines engineering logic with live operating data for reliable, site-specific optimization.
Actionable, not theoretical
We do not just report inefficiencies. We identify where performance drifts, what it means, and what to do next.
Safe by design
You decide the level of autonomy. From recommendation mode to closed-loop control, operators stay in charge.
Fast to implement
We connect to your existing BMS using standard protocols – no rip-and-replace required.
Proven in mission-critical environments
Trusted by leading operators in data centers and industry, with measurable impact on efficiency and operations.
Equinix, Merck, and others achieve up to 50% cooling energy savings with etalytics. Explore our case studies.
Request a feasibility study to evaluate real-time monitoring dashboards for your site. We assess connectivity, data readiness, and which KPIs and dashboards deliver the fastest impact on energy costs and operational efficiency.
Trusted by operators across data centers and industry


We empower industries to make complex energy systems and operations more intelligent, efficient, and resilient — with AI and digital twins that operators can trust.


.webp)